



Eighteen goals win a Golden Boot in Nigeria. Twenty-seven wins one in England. That gap has little to do with talent. It comes down to minutes and the NPFL's brutal scoring environment, which is exactly why total goals is a misleading way to rank finishers.
Goals per 90 strips out playing time and asks the sharper question of when a striker is on the pitch, how often does the ball end up in the net?
NPFL's Top Scorers in the 2026 Season
The 2025/26 race has been the tightest in years, decided not by a runaway striker but by a cluster of forwards separated by single goals across a 38-game grind.
Leading Goal Scorers in the League
Three players finished level on 14 goals at the top of the final 2025/26 scoring chart, reflecting how evenly distributed the output was. For most of the run-in, debut-season forward Joseph Arumala of Ikorodu City set the pace, with two former Golden Boot winners, Godwin Obaje (2016) and Emeka Obioma (2022/23), in pursuit.
The Matchday 34 snapshot, four games from the finish, showed how fine the margins were:
| Player | Club | Goals |
|---|---|---|
| Joseph Arumala | Ikorodu City | 12 |
| Godwin Obaje | Rangers International | 11 |
| Emeka Obioma | Abia Warriors | 11 |
| Victor Mbaoma | Remo Stars | 10 |
| Uche Collins | Katsina United | 10 |
| Daddy Abdulrahman | El-Kanemi Warriors | 10 |
| Jonathan Mairiga | Wikki Tourists | 10 |
Premium Times’ standings as of Matchday 34. It was the tightest NPFL top scorers race in years, and one no single forward ever ran away with.
Players Converting Chances at Elite Rates
Raw totals tell you who played and scored, not who was most lethal per opportunity. A forward on 10 goals from 1,500 minutes is, in finishing terms, deadlier than a 14-goal striker who played every minute of 38 matches.
Across the league, 2025/26 produced 769 goals in 380 matches, or 2.02 per game, the baseline that frames how much each conversion is worth.
NPFL Deadliest Finishers by Goals per 90
Goals per 90 minutes is the analytics-era answer to an old problem: comparing players who don't play the same amount. The calculation itself is simple:
- Total the player's league goals for the season.
- Divide that figure by the minutes they actually played.
- Multiply the result by 90.
What comes out is a score normalised to a full match — compiled from NPFL match data rather than estimated. 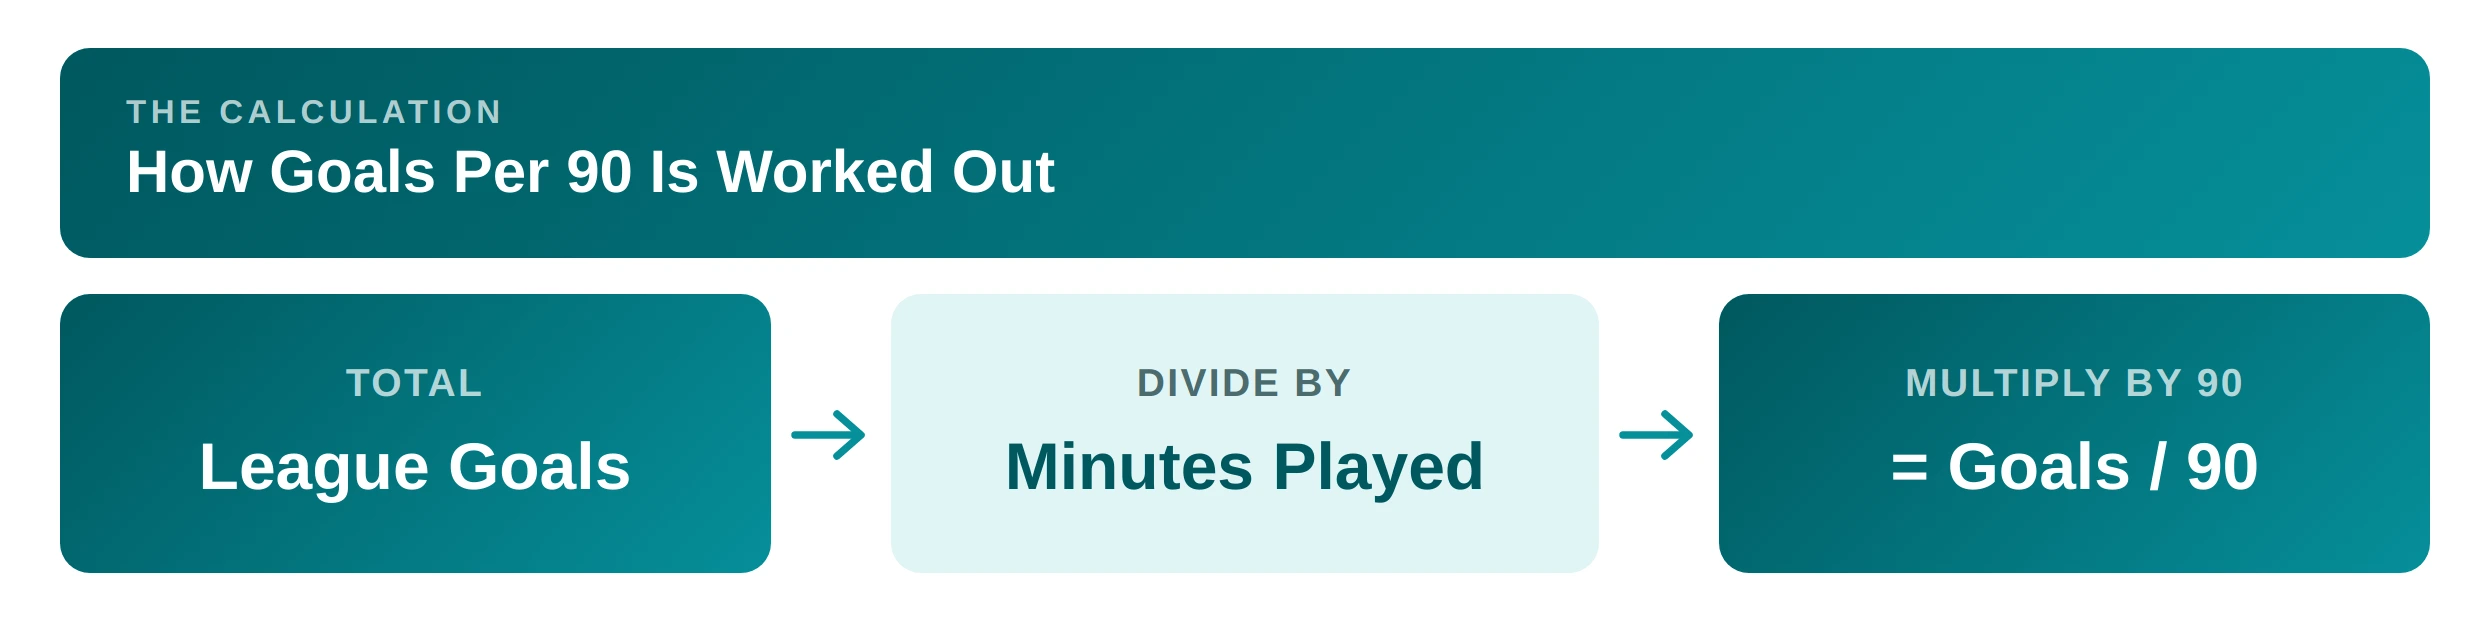
Strikers With Elite Conversion Rates
The deadliest finishers in football aren't always the names at the top of the goal chart. And the best finishers in football are routinely separated from the best volume scorers by this metric.
A striker who scores 9 in 1,200 minutes posts a goals-per-90 around 0.68, comfortably ahead of a 14-goal forward who needed 3,200 minutes, whose ratio sits near 0.39. Modern tracking and telemetry expose that gap with precision. 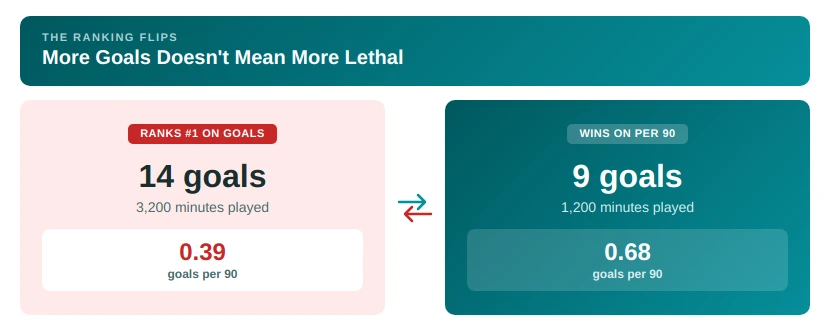 In the NPFL's low-scoring environment, any forward sustaining a ratio above 0.5 across a full season belongs in the elite-efficiency bracket.
Midfielders Overperforming in Attack
A per-90 analysis also surfaces players that the raw chart hides. Midfielders whose minutes are split between creation and finishing. Kano Pillars veteran Rabiu Ali is the archetype: a midfielder whose longevity is its own statistic, having reached double-digit goal involvement for the 11th straight season, scoring 13 in 2024/25, including four direct free-kicks.
When the NPFL players' top scorers list is filtered by per-90, a midfielder overperforming his position often outranks a striker fed a steady diet of chances. That shift is why the “best player in NPFL” and “NPFL player of the season” debates increasingly cite efficiency metrics, not just the goal tally.
Surprise Breakout Goal Machines
Every season throws up a name nobody benchmarked. In 2024/25, it was Shola Adelani of Ikorodu City, who scored 12 in his debut top-flight season before moving abroad. In 2025/26, Arumala followed a near-identical path at the same club, finishing as joint Golden Boot leader with 14 goals in a debut season.
Breakout finishers post the strongest per-90 numbers precisely because they arrive with fewer minutes. A high frequency of goals gets compressed into a partial season, and that dynamic flags a player before the transfer market catches on.
How NPFL Players Compare to Other African Leagues
Context turns a number into a verdict. An NPFL striker's output reads very differently once you set it against the continent's other top flights.
Efficiency vs Raw Scoring Output
The NPFL's 2.02 goals per game sits just above Ghana's Premier League at 1.98, where Augustine Okrah top-scored with 17. Both are defensively tighter than Europe, which compresses every forward's totals.
A 14-goal NPFL season and a 17-goal Ghanaian season represent similar per-90 efficiency once minutes and league scoring rates are normalised against the same baseline. Comparing raw totals across leagues without that adjustment produces nonsense.
Talent Development and Finishing Quality
As a development conveyor, the NPFL rarely keeps its best finishers. Scouts read per-90 efficiency as a cleaner predictor of transferability than gross goals. The ratio travels across different minute loads and tactical systems, making it the metric that survives a move abroad.
Factors That Influence Goals per 90 in NPFL
No single metric is immune to context. Several variables push a player's goals-per-90 up or down independently of pure finishing skill.
Playing Time and Rotation
Minutes matter as much as goals. A rotated forward accumulates fewer of them, which can inflate his per-90 on a small sample, the way a substitute who scores in 30 minutes posts a misleadingly elite frequency.
Minutes played is the first of the parameters any honest per-90 reading accounts for: a ratio built on 600 minutes carries far more variance than one on 3,000, and the probability of regression is high. A reliable efficiency coefficient needs a full season behind it.
Tactical Systems and Team Strength
A striker at a possession-dominant side sees more chances than one at a relegation-battling team, and that team strength feeds straight into output. The 2025/26 champions, Enugu Rangers, and runners-up Rivers United created attacking volume that lifted their forwards' raw numbers.
A striker at a struggling club might post a stronger per-90 on thinner service, which is a more impressive finishing return in context.
Penalties vs Open Play Goals
Not all goals weigh the same in a finishing analysis. When Chijioke Mbaoma won the 2023/24 Golden Boot with 17 goals, eight came from the penalty spot and nine from open play.
Non penalty goals per 90 filters this out, isolating open-play finishing and stripping away the penalty-taker's advantage. Scouting methodology sets its benchmarks here: a striker leaning heavily on spot-kicks sees his non-penalty per 90 fall sharply, a distinction the headline number conceals.
Why Some High Scorers Don't Lead Per 90 Rankings
The forward who tops the goal chart is usually the one who plays the most, not the one who finishes best. Three things separate a goal-chart leader from a per-90 leader:
- Volume from availability: An ever-present striker banking 14 goals across 3,200 minutes can sit below a rotation forward who scored 9 in 1,300, whose scoring frequency is simply higher.
- Penalty inflation: Spot-kicks pad a raw tally without reflecting open-play finishing, so a regular penalty-taker's per-90 flatters his true accuracy.
- Generous service: A forward at an attacking side gets more chances, lifting his total on volume rather than on the quality of his finishing.
Anas Yusuf's 18-goal Golden Boot in 2024/25 was a tally built on consistent availability across the full Nasarawa United season; a genuine per-90 ranking might place a less prolific but more efficient finisher above him. Analysts treat the goal chart and the efficiency index as two separate questions: one measures output, the other accuracy. 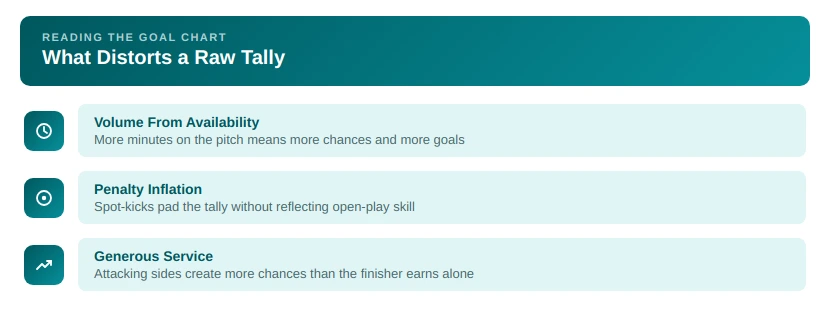
Future Stars to Watch in NPFL Attacking Charts
The forwards posting elite per-90 numbers in partial seasons are the names to track, because the metric flags them before their totals do. Arumala, fresh off a debut-season scoring lead, fits the profile of a player whose efficiency precedes his reputation. Chidera Michael, part of the chasing pack on 10 goals, is another emerging name. The pattern holds: the NPFL's most transfer-ready finishers announce themselves through frequency and conversion rate first and gross totals later, which is why goals per 90 has become the scouting metric of choice.